
Introduction
This guide demonstrates how to run an SQL Server Profiler trace. A “profiler trace” is a capture of the
background activity that is occurring in SQL Server. This could be an application writing data into the
database or a service which is executing SQL queries, etc.
These traces are useful to the development teams to help diagnose application and SQL issues.
Different Types of Traces
There are different types of profiler traces. The most common is a “capture-all”, this will log all SQL
activity that is occurring at the time of the trace.
There are also more specific traces, such as ‘Deadlock Graphs’. A Deadlock Graph will capture any
SQL table that has been deadlocked and what processes have locked it. This type of trace is not
covered in this guide.
It is possible to run a profiler trace without SQL Server Profiler running. This reduces the load on SQL
Server and can be left to run overnight. This particular trace is not covered in this guide.
This guide covers the more common “capture-all” trace, including the filtering options that can be
applied to it.
Installing SQL Server Profiler
To run a profiler trace, the SQL Server Profiler utility is required. This is part of Microsoft SQL Server
Management Studio, so this needs to be installed on the system first.
SQL Server Management Studio is included with the Symmetry installation files. However, it is
recommended to download the latest version from Microsoft’s website.
This application is normally installed on the server but is not limited to.
Opening SQL Server Profiler
To open SQL Server Profiler, open SQL Server Management Studio. This is normally available from
the Start menu on the server as shown below.
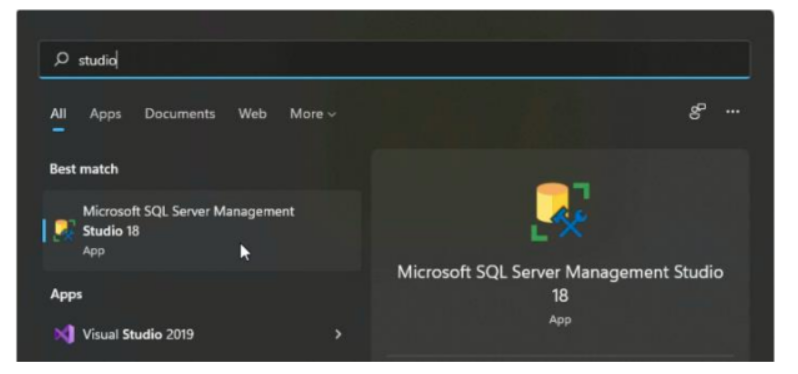
Note: this will differ according to the version of Windows and SQL Server Management Studio.
In SQL Server Management Studio, click Connect and navigate to: Tools > SQL Server Profiler as
shown below.

Click Connect and the Trace Properties window will appear.

Change the ‘Trace name’ to something that briefly describes the issue, as highlighted in yellow. It is
advised to include the ticket number so the trace can be linked to a ticket.
Make sure the ‘Use the template’ option is set to ‘Standard (default)’.
All other options will remain as default for this type of trace
Note: it is possible to save the trace directly to file by selecting the ‘Save to file’ option. This is not always
required as the trace can be saved to file afterwards.
Setting up Events
Events are the types of data and columns that will be traced. Not all events are required, even in a
capture-all.
The events can be enabled or disabled by navigating to the ‘Events Selection’ tab highlighted in yellow below.
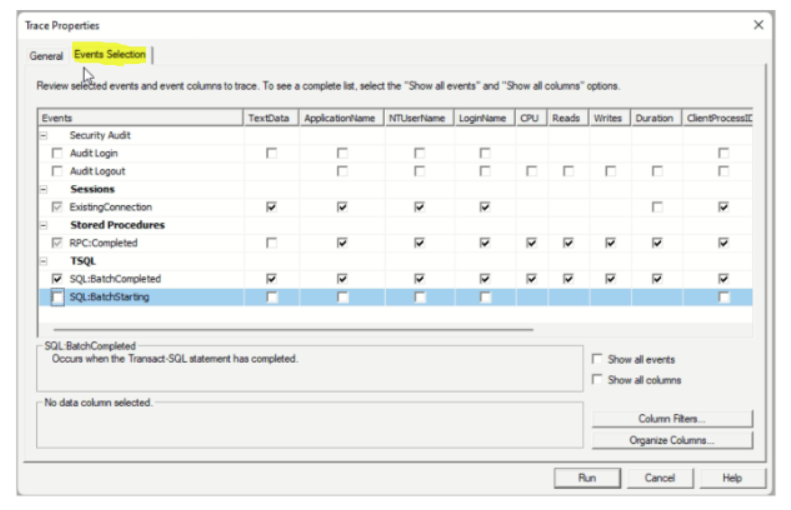
Uncheck the following Events as shown in the screenshot:
Security Audit
-
Audit Login
-
Audit Logout
TSQL
-
SQL:BatchStarting
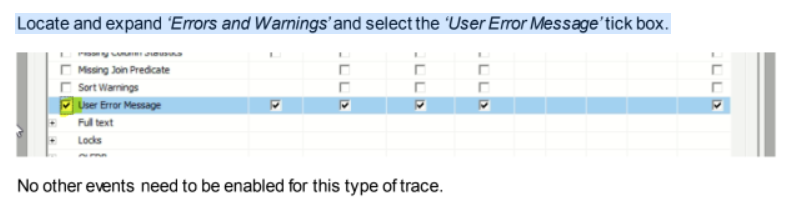
Click on the ‘Show all events’ tick box as highlighted in yellow:

Locate and expand ‘Errors and Warnings’ and select the ‘User Error Message’ tick box.
Setting up Filters
This step is not required if all SQL activity isto be logged in the trace. For example, if there is a
system wide performance issue, where all Symmetry menus are slow, a filter would not be required
here so this step can be skipped. Please move to ‘Running the Profiler Trace’.
If the fault is occurring within a specific component of Symmetry, such as one of the Symmetry Services
or a certain menu in Symmetry, it is possible to further pinpoint the trace against this process.
To filter against a certain process, the Process ID needs to be captured first. The Process ID is obtained
from the machine having the issue. For example, if the fault is on a Symmetry client, the Process ID of
Symmetry needs to be obtained from this machine.
To do this, open Task Manager on this PC. This is done by right-clicking the Start menu and selecting
‘Task Manager’.
Right-click the columns at the top of the menu, such as ‘Status’, and select the ‘PID’ option as shown
below.
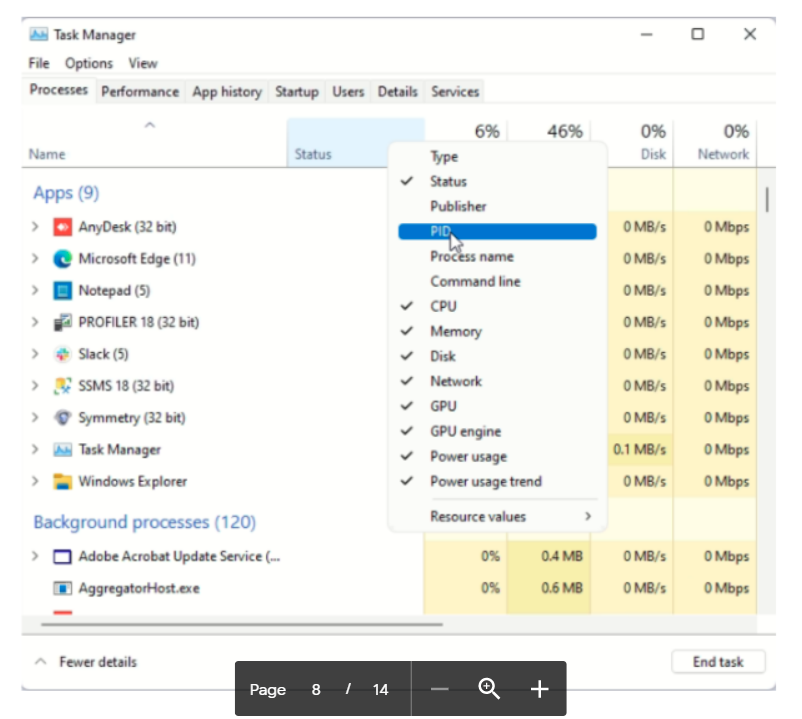
With the PID column now visible, locate the application or service that is causing the problem and record
the PID number as highlighted in yellow below.
For example, if the problem is happening inside of Symmetry, on a specific menu, record the PID
number of Symmetry. The fault will then need to be replicated from this application whilst Profiler is
running.
If a service is at fault, record the PID number of this service.

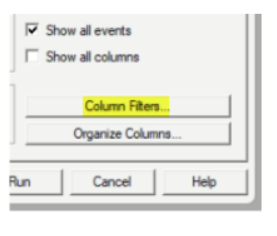
Navigate back to the SQL Server Profiler utility and click the ‘Column Filters...’ button as highlighted
below:
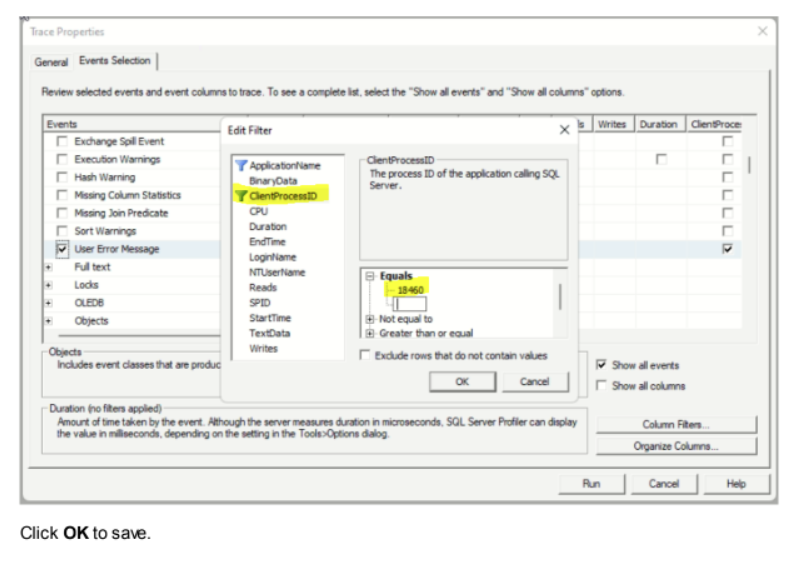
Click on ‘ClientProcessID’ on the left-hand side.
Under ‘Equals’, type in the PID number that was recorded previously.
Make sure the ‘Enter’ key is pressed so that the PID number is accepted by the filter, as shown below.
Running the Profiler Trace
Before running the trace, it is best to get in a position where the issue is ready to be repeated.
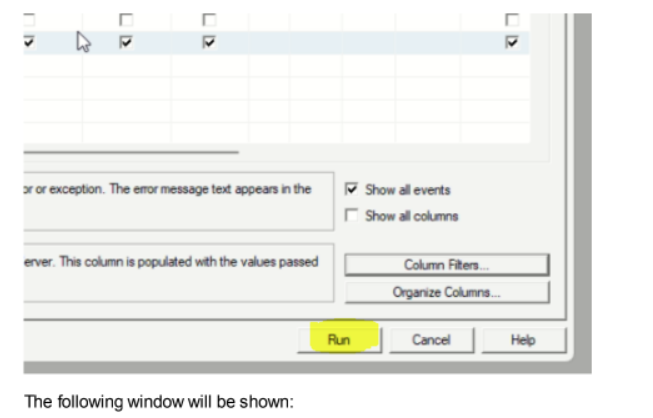
Once ready, click Run to start the trace.

Now repeat the fault that is occurring. Make sure dates, times and actions are recorded so these can be cross referenced in the trace by the development team.
If the fault is with a specific menu in Symmetry, repeat the fault on the client with the captured Process
ID, these actions will now be written into the trace. Record what menus were accessed and at what
times.
If the fault cannot be repeated, or a “capture-all” is being run which captures all SQL traffic, it is normally
best practice to leave the trace running for a maximum of 10 minutes.
SQL Server Profiler uses resources which can impact system performance. It is advised to not
leave Profiler running for extended periods of time.
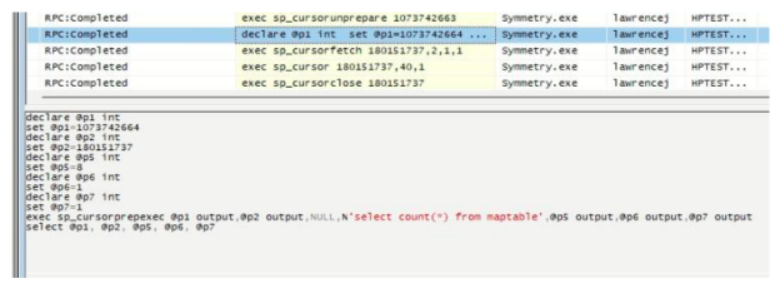
Profiler will be capturing the SQL connections and queries taking place; it is possible to see the query
by clicking on the entry in the list as shown below.
Stopping and Saving the Trace
If the fault has been repeated with the trace running, or the trace has been left for 10 minutes to capture
everything, it can now be stopped and saved.
Before stopping, make sure that the date and times in the trace are current. Sometimes the trace can
be behind in time if there are performance issues. Before clicking Stop, it is useful to wait a few seconds
to make sure the trace is up-to-date and contains the latest data. If the trace is stopped too early it will
be missing data.
To stop the trace, simply click the red square icon in the taskbar as shown below.

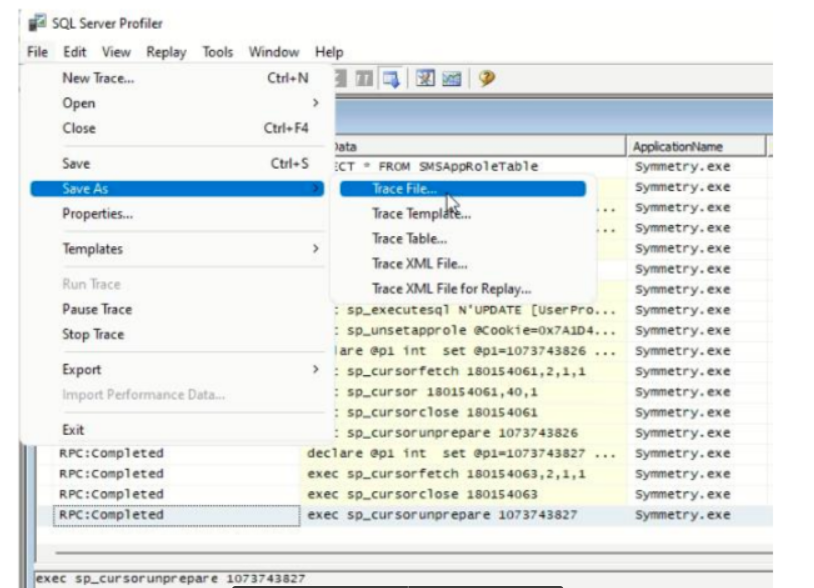
Once stopped, the trace can now be saved to file under File > Save As > Trace File... as shown below.
Depending on the size of the system, it may take some time to save the file. Make sure the trace file
has 100% saved, this status is viewable in the bottom left corner of Profiler (as it is saving).
Once finished, make sure the trace has been stopped and SQL Server Profiler has been closed.
The *.TRC trace file can now be sent to the appropriate team for analysis. This is normally an SQL or
engineering team. Please capture the application versions and any other associated data that will be
useful for diagnostics.
Comments
0 comments
Please sign in to leave a comment.